
Numbers first. Every case, every channel.
Every project below ships with a real performance metric — ROAS, organic lift, or conversion rate. No creative rationale, no before-and-after mood boards.


Across channels. Across industries.
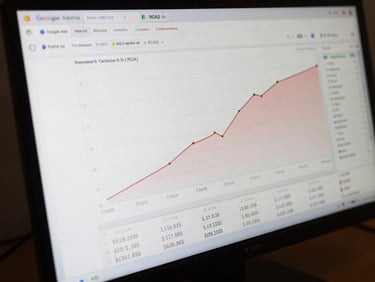
4.2× ROAS in 45 days
218% organic traffic lift
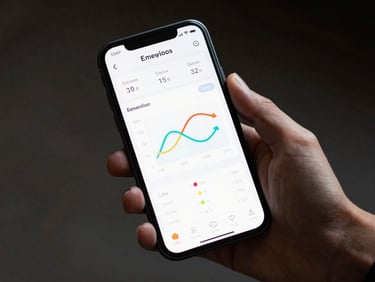
3.1× conversion rate increase
D2C fashion brand. Restructured campaign architecture and bid strategy; ad spend held flat while revenue per rupee climbed 320%.
Regional dental chain, 6 locations. Technical audit plus local citation rebuild; Page 1 rankings across 34 commercial keywords in 90 days.
Home furnishings retailer. Full Shopify rebuild with checkout UX overhaul; conversion rate moved from 0.9% to 2.8% within the first billing cycle.
₹38 cost-per-lead achieved
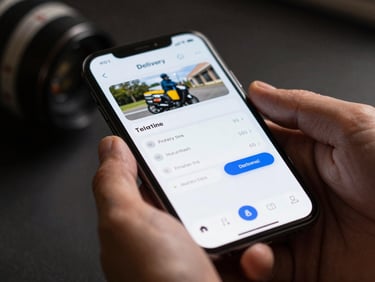
4.7-star app, 12k installs
40% recall lift post-rebrand
B2C education brand. Audience segmentation rebuild and creative rotation reduced CPL by 61% while monthly lead volume doubled in 60 days.
Hyperlocal logistics startup. End-to-end Android and iOS build; 12,000 installs in the first quarter with a 4.7 Play Store rating.
Mid-size FMCG manufacturer. Full visual identity system with packaging; unaided brand recall measured at 40% higher six months after launch.
120+ Projects
3.8× Avg ROAS
85k+ Leads
30-Day Results
Delivered across web, ads, apps, and brand — all with attribution tracking from day one.
Average return on ad spend across all active paid campaigns in the last 12 months.
Qualified inbound leads generated for clients across B2B and B2C sectors in India.
Every engagement ships its first measurable data point within 30 days. No 90-day waiting periods.
Your results belong on this page.
Book a free consultation. We scope the channels, set the attribution baseline, and show you what 30-day traction looks like for your category.
Brand Nirman
Building Brands, Creating Legacies.
Pages
Home
Services
About Us
Portfolio
Blog
Contact Us
Drop a line
+91 8700160291
India — Serving nationwide
Reply within one business day
(C) 2018 Brand Nirman-Multi-channel execution. Real attribution. No guessing.
Built for ROI. Measured in 30 days.